Merton (1969) and Samuelson (1969) study the optimal portfolio choice of a consumer with constant relative risk aversion .[1] This consumer has assets at the end of period equal to and is deciding how much to invest in a risky asset[2] with a lognormally distributed return factor , whose log is
The shock is mean-one in levels, (see ELogNormMeanOne), so is the log of the expected return factor, (upper-case variables like without a subscript are time-invariant means), while the mean of the log return is .
The alternative to the risky asset is a riskfree asset that earns return factor . Importantly, the consumer is assumed to have no labor income and to face no risk except from the investment in the risky asset.[3][4]
Both papers consider a multiperiod optimization problem, but here we examine a consumer for whom period is the second-to-last period of life (the insights, and even the formulas, carry over to the multiperiod case).[5]
If the period- consumer invests proportion in the risky asset, spending all available resources in the last period of life will yield:
where is the realized arithmetic return factor for the portfolio.
The optimal portfolio share will be the one that maximizes expected utility:
and can be calculated numerically for any distribution of returns.
Campbell & Viceira (2002) point out that if we define the realized log excess return
whose mean is , where is the log of the expected excess return factor , then for many distributions a good approximation to the log of the portfolio’s return factor is obtained by[6]
Using this approximation, the expectation as of date of utility at date is:
where the first term is a negative constant under the usual assumption that relative risk aversion .
Because the return is lognormal, we can make substantial further progress, by obtaining an analytical approximation to the numerical optimum. In this case (using NormTimes). With a couple of extra lines of derivation we can show that the log of the expectation in (6) is
Substitute from (7) for the log of the expectation in (6) and note that the resulting expression simplifies because it contains ; thus the log of the “excess return utility factor” in (6) is
and the that minimizes the log will also minimize the level; minimizing this when is equivalent to maximizing the terms multiplied by , so our problem reduces to
Equation (10) says[7] that the consumer allocates a higher proportion of their net worth to the high-risk, high-return asset when
the amount by which the risky asset’s return exceeds the riskless return is greater
the consumer is less risk averse ( is lower)
riskiness is less
If there is no excess return, nothing will be put in the risky asset. Similarly, if risk aversion or the variance of the risk is infinity, again nothing will be put in the risky asset.[8]
This formula hints at the existence of an “equity premium puzzle” (Mehra & Prescott (1985)). Interpreting the risky asset as the aggregate stock market, the annual standard deviation of the log of U.S. stock returns has historically been about yielding . The equity premium over historical periods has been something like (eight percent). With risk aversion of this formula implies that the share of risky assets in your portfolio should be or 100 percent! The fact that most people hold far less than 100 percent of their wealth in stocks, and that many hold none, is the “stockholding puzzle,” the microeconomic manifestation of the equity premium puzzle (Haliassos & Bertaut (1995)).
To avoid the problems caused by a prediction of a risky portfolio share greater than one, we can calibrate the model with more modest expectations for the equity premium. Taking evidence from other countries and longer periods into account, Dimson et al. (2008) estimate that investors can expect a premium of about 3 to 3½ percent on a geometric basis, or 4½ to 5 percent on the arithmetic basis that matches . Figure 1 shows the relationship between the portfolio share and relative risk aversion for a deliberately modest premium of 3 percent and a large standard deviation of . Even when risks are this high and the premium is this low, if relative risk aversion is close to logarithmic () the investor wants to put well over half of the portfolio in the risky asset. Only for values of risk aversion greater than 2 does the predicted portfolio share reach plausible small values.
But remember that these calculations are all assuming that the consumer’s entire consumption spending is financed by asset income. If the consumer has other income (for example, labor or transfer income) whose covariance with the risky return is small, they should be willing to take more risk. Since, for most consumers, most of their future consumption will be financed from labor or transfer income, it is not surprising to learn that models calibrated to actual data on capital and noncapital income dynamics imply that people should be investing most of their non-human wealth in the risky asset, with reasonable values of Cocco et al., 2005.
Another question is what the expected rate of return on the consumer’s portfolio will be once the portfolio share in risky assets has been chosen optimally. Note first that (16) implies that
while the variance of the log of the excess return factor for the portfolio is . Substituting the solution (10) for into (11), we have
which is an interesting formula for the excess return of the optimally chosen portfolio because the object (the excess return divided by the standard deviation) is a well-known tool in finance for evaluating the tradeoff between risk and return (the “Sharpe ratio”). Equation (12) says that the consumer will choose a portfolio that earns an excess return proportional to the square of the Sharpe ratio and inversely proportional to the risk aversion coefficient. Higher reward (per unit of risk) convinces the consumer to take the risk necessary to earn higher returns; but higher risk aversion convinces the investor to sacrifice (risky) return for safety.
Finally, we can ask what effect an exogenous increase in the risk of the risky asset has on the endogenous riskiness of the portfolio once the consumer has chosen optimally. The answer is surprising: The variance of the optimally-chosen portfolio is
which is actually smaller when is larger. The reason: a riskier asset pays less per unit of variance. Cutting the share only enough to restore the portfolio’s variance would leave the same risk at a lower expected return, so the investor cuts it further.
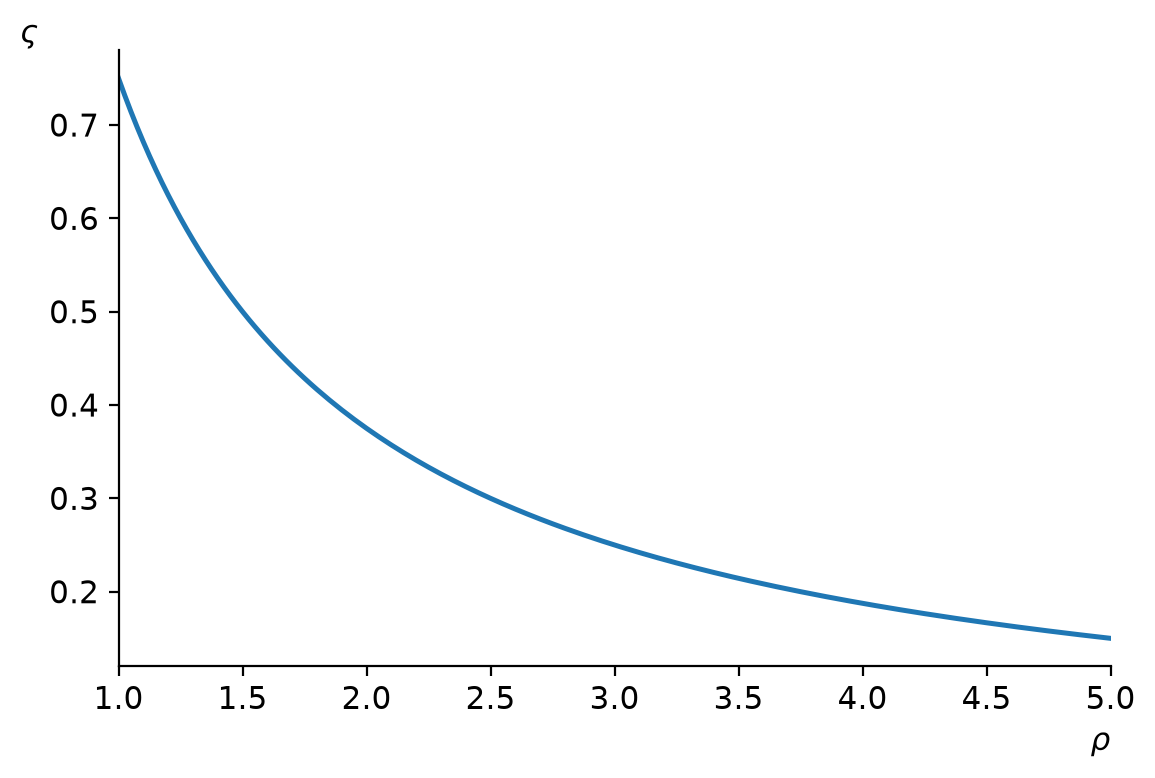
Figure 1:The Approximate Risky Portfolio Share Declines as Relative Risk Aversion Increases
Note: The approximation with a premium of and , drawn by the notebook.
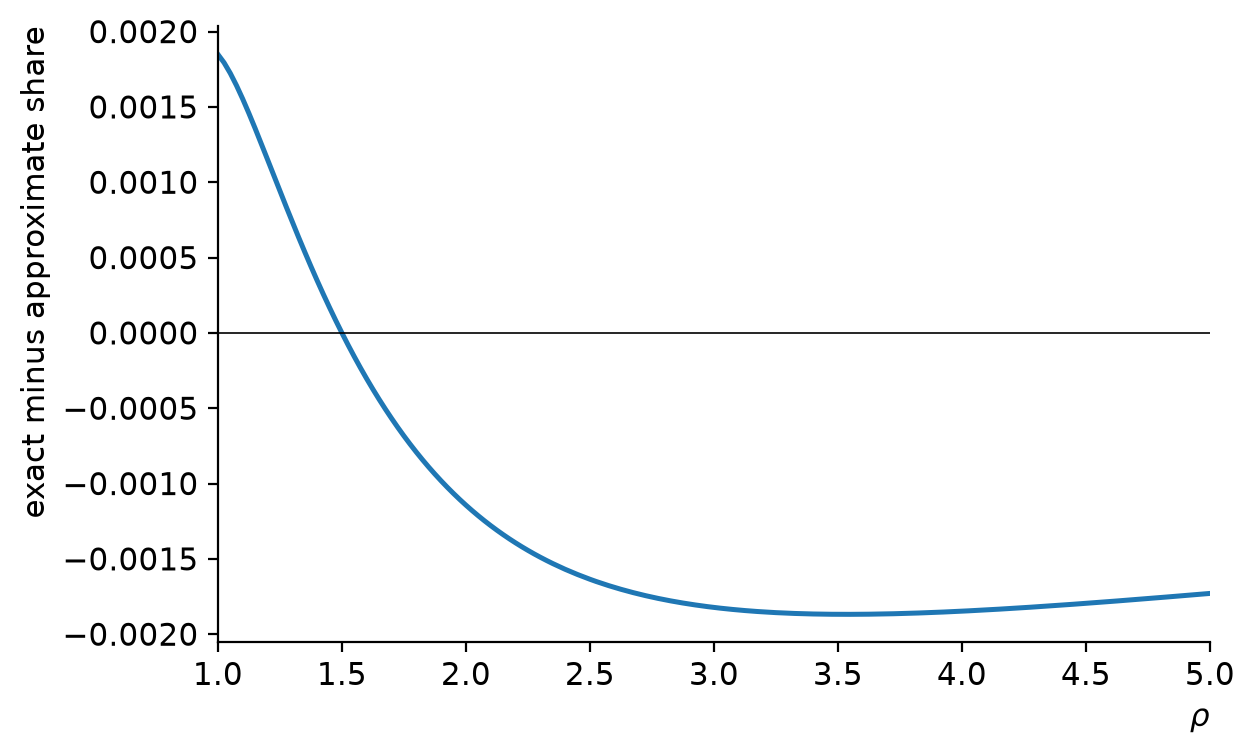
Figure 2:The Approximation Error for the Portfolio Share in Risky Assets Is Small
Note: The exactly optimal share minus the approximation, for the same parameters. The notebook finds the exact share numerically, and its sliders vary the premium and the volatility; run it in your browser with nothing to install, in JupyterLite, or open it in Colab or Binder.
1Appendix: The Campbell & Viceira (2002) Approximation
For mathematical analysis (especially under the assumption of CRRA utility) it would be convenient if we could approximate the realized arithmetic portfolio return factor by the geometric one, , because the log of the geometric factor is , so the realized “portfolio excess return” would be simply . Unfortunately, for values well away from 0 and 1 (that is, for any interesting values of portfolio shares), the log of the geometric mean is a badly biased approximation to the log of the arithmetic mean when the variance of the risky asset is substantial.
Campbell & Viceira (2002) propose instead
To see one virtue of this approximation,[9] note (using NormTimes and SumNormsIsNorm) that since the mean and variance of are respectively and , fact LogELogNormTimes implies that
which means that exponentiating then taking the expectation then taking the logarithm of (5) gives
or, in words: The expected excess portfolio return is equal to the proportion invested in the risky asset times the expected excess return of the risky asset.[10]
.
Both papers present the solution in the case with multiple risky assets; for the two-asset case, see two risky assets.
A common interpretation is that this is the problem of a retired investor who expects to receive no further labor income. Note however that all risks other than the returns from financial investments have been ruled out; for example, health expense risk is not possible in this model, though recent research has argued such risk is important (maybe even dominant) later in life (cf. Ameriks et al. (2011)).
Riskless labor income can trivially be added to the problem, because its risklessness means that (in the absence of liquidity constraints) it is indistinguishable from a lump sum of extra current wealth with a value equal to the present discounted value (using the riskless rate) of the (riskless) future labor income. Of course, in practice, labor income is not riskless, but when labor income is risky the problem no longer has the tidy analytical solution described here and must be solved numerically. See Carroll (2023) for an introduction to numerical solution methods.
This expression differs slightly from that derived by Campbell & Viceira (2002), because we adjust the mean logarithmic return of the risky investment for its variance in order to keep the mean return factor constant for different values of the variance (cf. (4)), which makes comparisons of alternative levels of risk more transparent.
The approximation is motivated by the continuous-time solution, which is obtained using Ito’s lemma.
We use the word “return” always to mean the logarithm of the corresponding “factor”; and when not explicitly specified, we always take the expectation before taking the log; if we wanted to refer to we would call it the expected log portfolio return (to distinguish it from the expected portfolio return, ).
- Merton, R. C. (1969). Lifetime Portfolio Selection under Uncertainty: The Continuous-Time Case. Review of Economics and Statistics, 51(3), 247–257. 10.2307/1926560
- Samuelson, P. A. (1969). Lifetime Portfolio Selection by Dynamic Stochastic Programming. Review of Economics and Statistics, 51, 239–246.
- Campbell, J. Y., & Viceira, L. M. (2002). Appendix to Strategic Asset Allocation: Portfolio Choice for Long-Term Investors. Oxford University Press. https://scholar.harvard.edu/files/campbell/files/bookapp.pdf
- Mehra, R., & Prescott, E. C. (1985). The Equity Premium: A Puzzle. Journal of Monetary Economics, 15(2), 145–161. 10.1016/0304-3932(85)90061-3
- Haliassos, M., & Bertaut, C. C. (1995). Why Do So Few Hold Stocks? The Economic Journal, 105(432), 1110–1129. 10.2307/2235407
- Dimson, E., Marsh, P., & Staunton, M. (2008). The Worldwide Equity Premium: A Smaller Puzzle. In R. Mehra (Ed.), Handbook of the Equity Risk Premium (pp. 467–514). Elsevier.
- Cocco, J. F., Gomes, F. J., & Maenhout, P. J. (2005). Consumption and Portfolio Choice over the Life Cycle. Review of Financial Studies, 18(2), 491–533.
- Ameriks, J., Caplin, A., Laufer, S., & Van Nieuwerburgh, S. (2011). The Joy Of Giving Or Assisted Living? Using Strategic Surveys To Separate Public Care Aversion From Bequest Motives. The Journal of Finance, 66(2), 519–561.
- Carroll, C. D. (2023). Solving Microeconomic Dynamic Stochastic Optimization Problems. Econ-ARK REMARK. https://llorracc.github.io/SolvingMicroDSOPs
- Samuelson, P. A. (1979). Why we should not make mean log of wealth big though years to act are long. Journal of Banking and Finance, 3(4), 305–307. 10.1016/0378-4266(79)90023-2