Economic agents face risks of many kinds, which may mutually covary. A stock broker, for example, is likely to earn a salary bonus that is positively related to the performance of the stock market; if that broker also has personal stock investments, his financial wealth and labor income will be positively correlated.
The first part of this section presents a convenient (and empirically realistic) formulation in which a consumer faces two shocks (which can be interpreted as a shock to noncapital income and a shock to the rate of return) that are distributed according to a multivariate lognormal that allows for correlation between them. The second part describes a computationally simple and convenient method for approximating that joint distribution.
1Theory
Consider a consumer who faces both a risk to transitory noncapital income[1]
and a risky log rate-of-return that is affected by following factors: the riskless rate ;
a risk premium ; an additional constant (whose purpose will become clear below); a component that is linearly related to ; and an independent shock :
for some constant . Since is the only component of that covaries with ,
Equation (2) yields a description of the return process in which the parameter controls the correlation between the risky log return shock and the risky log labor income shock. If the processes are independent.
Now we want to find the value of such that the mean risky return is unaffected by (so that we will be able to understand clearly the distinct effects of labor income risk, the independent component of rate-of-return risk , and the correlation between labor income risk and rate-of-return risk, ). Thus, we want to find the such that
regardless of the values of and . We therefore need:
Using standard facts about lognormals (cf. Math Facts), and for convenience defining , we have
Because the two shocks are independent by construction, the joint distribution takes a convenient form. Stacking and into a vector , we can write
where and the covariance matrix is diagonal, carrying and .[2]
2Computation
A key step in the computational solution of any model with uncertainty is the calculation of expectations. Writing and and , the expectation of some function that depends on the realization of the risky return and the labor income shock is:
where is the joint cumulative distribution function. Standard numerical computation software can compute this double integral, but at such a slow speed as to be almost unusable.
Computation of the expectation can be massively speeded up by advance construction of a numerical approximation to .
Such approximations generally take the approach of replacing the distribution function with a discretized approximation to it; appropriate weights are attached to each of a finite set of points indexed by and , and the approximation to the integral is given by:
where the and matrices contain the conditional means of the two variables in each of the regions. Various methods are used for constructing the weights and the nodes (the and points for and ).
Perhaps the most popular such method is Gauss-Hermite interpolation (see Judd (1998) for an exposition, or Kopecky & Suen (2010) for some alternatives). Here, we will pursue a particularly intuitive alternative: Equiprobable discretization. In this method, and boundaries on the joint CDF are determined in such a way as to divide up the total probability mass into submasses of equal size (each of which therefore has a mass of ). This is conceptually easier if we represent the underlying shocks as statistically independent, as with and above; in that case, each submass is a square region in the and grid. We then compute the average value of and conditional on their being located in each of the subdivisions of the range of the CDF. Since, in this specification, is a function of , the values are indexed by both and , but since we have written as IID, the representation of the approximating summation is even simpler than (9):
where the function is implicitly defined by (2).
Details can be found in the Mathematica notebook associated with this section. A particular example, in which and , is illustrated in Figure 1; the red dots reflect the height of the approximation to the CDF above the conditional mean values for and within each of the equiprobable regions.
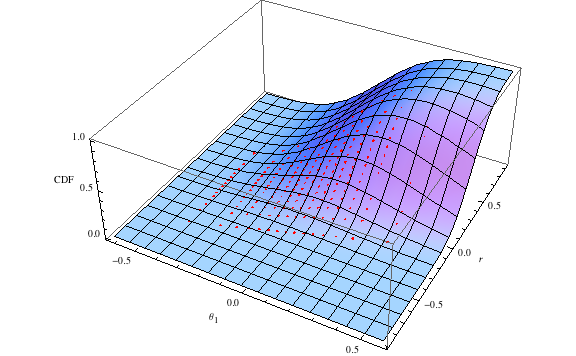
Figure 1:‘True’ CDF With Approximation Points in Red for
The assumed distribution has the property , cf. Math Facts.
An alternative would be to work with and directly, which would require a multivariate normal with nonzero off-diagonal elements. The two approaches are mathematically indistinguishable, and we take the independent one because it is the more convenient to integrate against below.
- Judd, K. L. (1998). Numerical Methods in Economics. The MIT Press.
- Kopecky, K. A., & Suen, R. M. H. (2010). Finite State Markov-Chain Approximations To Highly Persistent Processes. Review of Economic Dynamics, 13(3), 701–714. 10.1016/j.red.2010.02.002