Equiprobable Approximation to Bivariate Lognormal Returns
Authors
Affiliations
Johns Hopkins University
Econ-ARK
Johns Hopkins University
Econ-ARK
This section starts by defining a convenient notation to represent two rate-of-return shocks
that are distributed according to a multivariate lognormal that allows
for nonzero covariances. It next presents a computationally
simple method for constructing a numerical approximation to that joint distribution. The final
section uses both the numerical approximation, and more accurate (but enormously slower) standard numerical integration tools to assess the accuracy of the Campbell-Vicera analytical approximation to the solution to the optimal portfolio choice problem
described in Portfolio-Multi-CRRA.
which are statistically independent (θ1,t+1⊥θ2,t+1) even though the scale of shock 1’s
standard deviation is determined by the proportionality factor
x multiplied by the value of shock 2’s standard deviation,
Σ. (This permits us to increase or decrease the size of both risks
by changing Σ and to adjust the relative size of risk 1 vs risk 2 by adjusting x.)
The θ are interpreted as the logarithms of level variables Θ, and the means of the log variables have been chosen such that the expectations
of the levels are independent of the size of the risk (cf. Math Facts). That is, defining Θi=Et[eθi,t+1] for i∈{1,2}:
where θ1,t+1∼N(0.,(xΣ)2); the notation for θ is motivated by the fact that the addition of the extra term cancels the nonzero mean of the original θ. Then
Thus, the parameter ω controls the covariance between the risky returns. If we set ω=0 then r1,t+1⊥r2,t+1 (the returns are independent).
Next we want to find the value of ζ such that the expected level of the return is unaffected by Σ (so
that we will be able to explore independently the distinct effects of the
components of each shock and their covariance):
Hence, from the independent mean-one lognormally distributed shocks
Θ1 and Θ2, we have constructed a pair of
jointly lognormally distributed shocks whose covariance is controlled
by the parameter ω, whose relative and absolute variances are
controlled by the parameters x and Σ, and whose means
are r1 and r2.
To sum up, the process can be described in either of two ways:
To reduce clutter, define R~i=Ri,t+1 and interpret E as Et[], so that we can write the expectation of some function h that depends on the realization of
the return shocks as:
where F(R~1,R~2) is the cumulative distribution
function for a multivariate lognormal with the covariance matrix defined by (12).[1]
Standard numerical computation software can compute this double integral, but at such a slow speed as to be unusable for many purposes.
Computation of the expectation can be massively speeded up by
advance construction of a numerical approximation to
F(R~1,R~2).
Such approximations often take the approach of replacing the distribution function
with a discretized approximation to it; appropriate weights w[i,j] are attached to
each of a finite set of points indexed by i and j, and
the approximation to the integral is given by:
where various methods are used for constructing the weights w[i,j] and the nodes (corresponding to the {i,j} pairs). The matrices R^1 and R^2 contain the conditional mean values of R~1 and R~2 associated with each of the regions.
Perhaps the most popular such method is Gauss-Hermite interpolation
(see Judd (1998) for an exposition, or Kopecky & Suen (2010)
for a recent candidate for a better choice). Here, we will pursue a
particularly simple and intuitive alternative: Equiprobable discretization. In
this method, m=n and boundaries on the joint CDF are determined in
such a way as to divide up the total probability mass into submasses
of equal size (each of which therefore has a mass of n−2). This
is conceptually easier if we represent the underlying shocks as
statistically independent, as with Θ1 and
Θ2 above; in that case, each submass is a square region
in the Θ1 and Θ2 grid. We then compute
the average value of Θ1 and Θ2
conditional on their being located in each of the subdivisions of
the range of the CDF. Since Θ1 and Θ2
are IID, the representation of the approximating summation is even
simpler than (15):
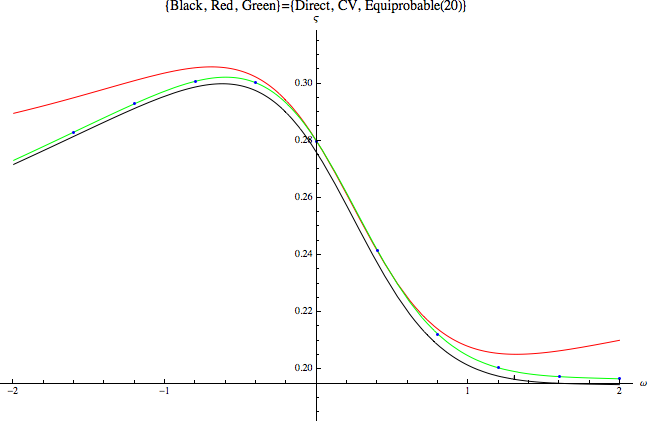
Figure 1:Portfolio Share By Method as a Function of ω
Figure 1 compares the computed optimal portfolio share for a numerical solution
using the built-in numerical optimizer and maximization functions (the lowest, black, locus), the Campbell-Viceira solution (the highest, red locus)
and an equiprobable approximation using 20 approximation points (green, middle) as well as the solution using the equiprobable approximation
at an evenly-spaced grid of points (blue dots).
Careful examination indicates that the numerical approximation is quite close to the full numerical solution, while the CV approximation diverges substantially from the numerical answer. The tradeoff is that the
equiprobable solution is about 2000 times slower than the CV approximation, while the direct solution is more than 100 times slower
than the equiprobable solution. Depending on the requirements of the problem being examined, these differences in
efficiency can make a tremendous difference in the feasibility of a research project.[2]
Judd, K. L. (1998). Numerical Methods in Economics. The MIT Press.
Kopecky, K. A., & Suen, R. M. H. (2010). Finite State Markov-Chain Approximations To Highly Persistent Processes. Review of Economic Dynamics, 13(3), 701–714. 10.1016/j.red.2010.02.002